
Project - Economics Data Analysis
This comprehensive, three-phase project guides students through an in-depth economic data analysis of the relationship between housing prices and unemployment in the United States from 2010 to 2023. Designed for learners at all levels, the project emphasizes both technical mastery of Excel and the development of economic reasoning and confidence to interpret real-world data. Students progress through three thoughtfully structured phases: beginning with foundational economic concepts and essential Excel skills, advancing to statistical analysis and regression, and culminating in advanced time series analysis and economic forecasting.

Master essential Excel skills for economic data analysis and visualization.
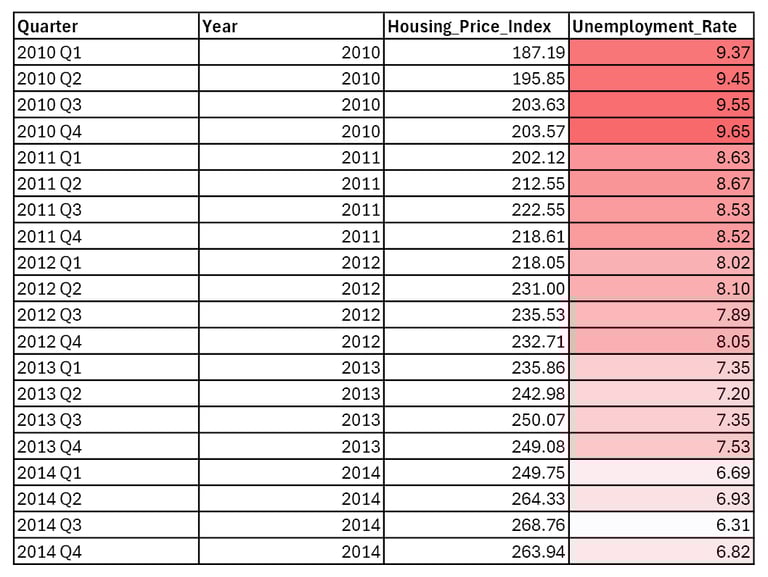
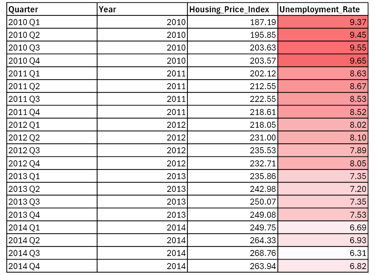
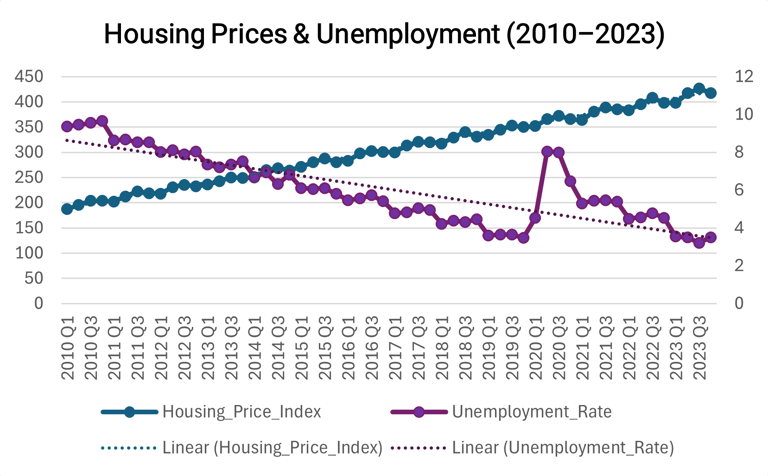
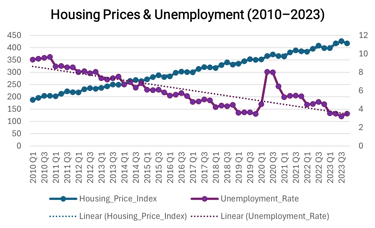
Understand and interpret key economic indicators like housing prices.
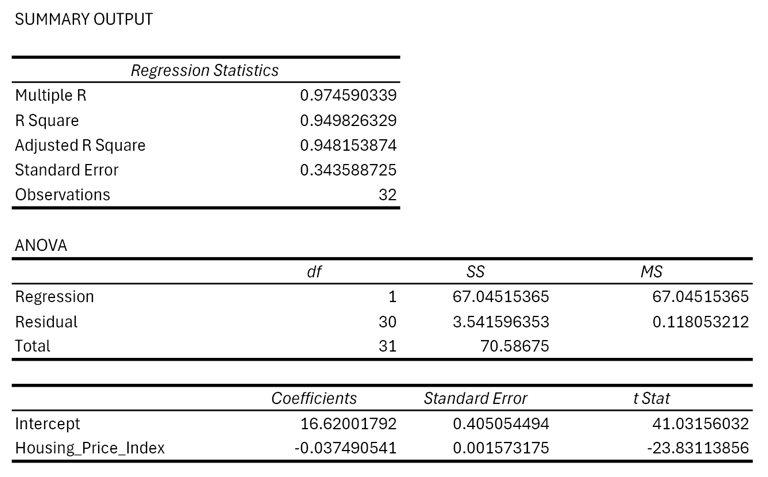
Apply descriptive statistics, correlation, and regression to analyze economic relationships.
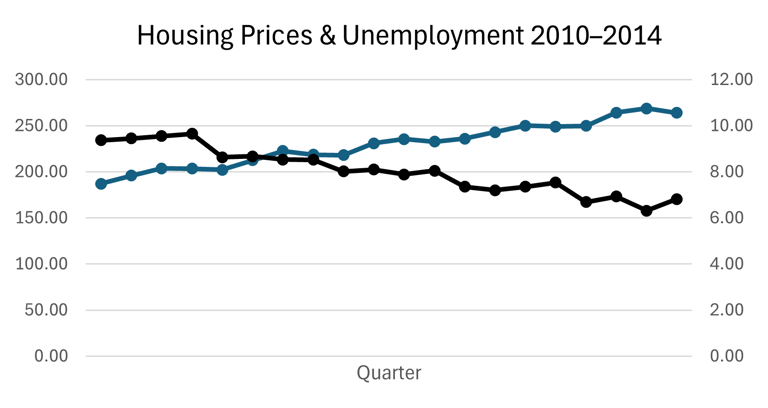
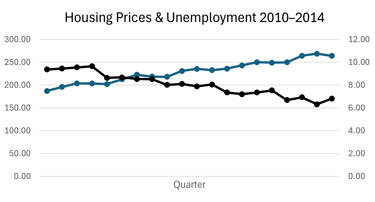
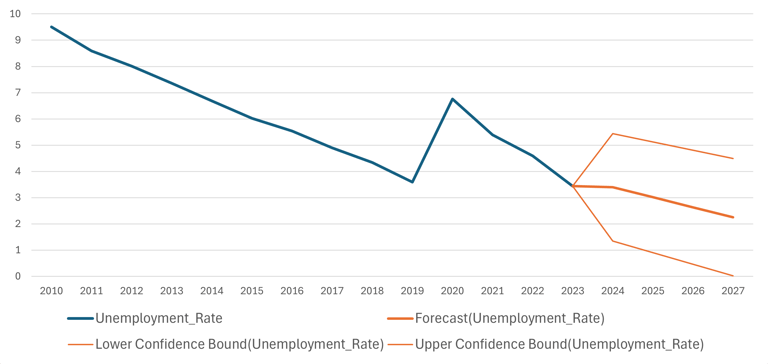
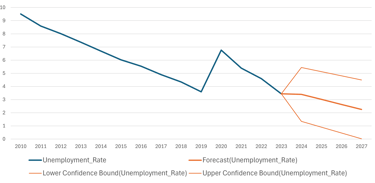
Analyze time series data using moving averages and forecasting techniques.
Create clear charts and write concise, data-driven economic reports.
Build confidence to independently apply economic analysis in real-world contexts.

Phase 1
Foundations of Economic Data Analysis
Phase 2
Statistical Analysis and Economic Relationships
Phase 3
Advanced Time Series Analysis and Economic Forecasting
Learning
Outcomes